Original Link: https://www.anandtech.com/show/1933
Seagate 7200.9 160GB: The Highest Platter Density to Date!
by Purav Sanghani on January 31, 2006 10:29 PM EST- Posted in
- Storage
Introduction
With the announcement and release of Seagate's new 160GB 5400.3 2.5" notebook drive, which utilizes the new perpendicular magnetic recording method, we have many questions regarding the performance of these new high density platters being manufactured for an extremely critical part of our systems. Because of this introduction to the new technology, we are also wondering what the threshold is as far as the maximum density and the performance of current longitudinal recording technology.
Seagate Technology is currently the single largest manufacturer of hard disk drives with over 40% of the market share after the acquisition of Maxtor Corporation in late December 2005. Seagate has a wide range of products from desktop external storage, all the way up to serial-attached enterprise hard disk drives, with the bulk of their sales to the mainstream market being desktop hard disk drives. Their sales have boomed with the help of a handful of third party PC manufacturers and also some technology partners who use Seagate products in their own.
After our review of the 500GB 7200.9 unit, many of you kindly requested a look at the 160GB 7200.9 Barracuda drive, which featured the new high density 160GB platter. The only other drive in the 7200.9 line that features this platter is the 80GB unit, but we decided to look at the 160GB version because we had a handful of 160GB drives to which to compare performance. The 160GB 7200.9 features an 8MB buffer, a SATA 3.0GB/sec interface and, obviously, a 7,200RPM spindle speed. Take a look at how the highest capacity platter performs compared to the others.
The Test
Our test bed specs have been laid out below. We used Western Digital's 160GB 3.0 Gb/sec drive, since it was the quickest in our 3-way SATA 3.0Gb/sec Shootout.
| Testbed | |
| Processor: | AMD Athlon 64 3500+ (2.2Ghz) |
| Memory: | 1GB (512MBx2) Corsair XMS4400 |
| Motherboard: | Giga-byte GA-K8NXP-SLI |
| Hard Drive: | Western Digital WD1600JS |
| Graphics Card: | NVIDIA 6600GT SLI Edition (single 128MB card) |
Our motherboard is an nForce4 based board, which features support for the SATA II standard, up to 3.0 Gb/sec SATA transfer rates, and NCQ and TCQ.
We used the following nForce platform drivers in conjunction with our testbed:
nForce4 Chipset Driver 6.82
NVIDIA graphics driver 71.89
Windows XP SP2 w/out further updates
| AnandTech Storage Tests | |
| Business Winstone IPEAK | a playback test of all of the IO operations that occur within Business Winstone 2004 |
| Content Creation IPEAK | a playback test of all of the IO operations that occur within Multimedia Content Creation Winstone 2004 |
| Half-Life 2 Level Load Test | Half-Life 2 level load time test |
| Doom 3 Level Load Test | Doom 3 level load time test |
| Command & Conquer: Generals Level Load Test | Command & Conquer: Generals level load time test |
| Real World File System Task Tests | timed tests of basic file system tasks including zipping/unzipping and copying files |
| HDTach | Synthetic test for transfer rate of hard disk during a full disk read |
| Service Time and Transfer Rate Tests | Synthetic tests for average service time and transfer rate of hard disk during a full disk read |
| Real World Multitasking Test | timed tests of basic multitasking processes, timing a file zip operation while importing Outlook data |
More details about each individual test will appear in the section of the review dedicated to that particular test.
Pure Hard Disk Performance - IPEAK
We begin our usual hard disk drive test session with Intel's IPEAK benchmarking utility. We first run a trace capture on Winstone 2004's Business and Multimedia Content Creation benchmark runs to catch all of the IO operations that take place during each test. We then play each capture back using RankDisk, which reports back to us a mean service time, or average time that the drive takes to complete an IO operation.
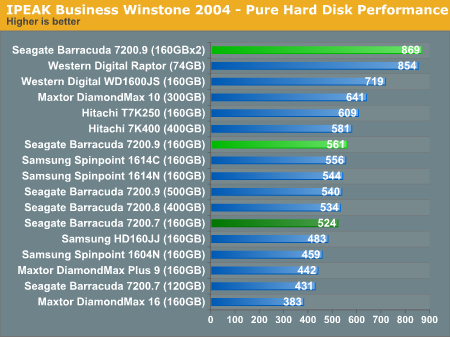
With two of these 160GB 7200.9 units in a RAID-0 setup, we see that the operations per second increase about 55%. We performed this test as a brief look at how RAID affects performance...and to prove to the skeptics that setting up two or more drives in RAID-0 at least will increase the performance. Here, we see that happening. Let's see if this trend continues.
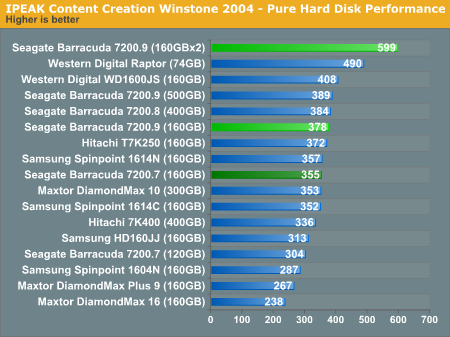
Let's take a look at Content Creation performance.
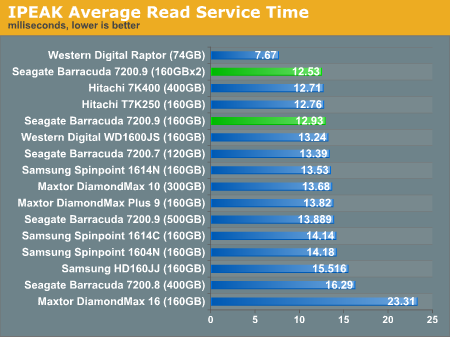
IPEAK Write Service Times
We have taken the liberty to also include the average Write Service Times for the 160GB 7200.9. The single 160GB 7200.9 drive has an average write service time of 8.67ms while our RAID-0 setup resulted in about half that at 4.67ms.
WinBench 99 - Transfer Rate Test
We ran WinBench 99's Disk Transfer Rate Test to get a better measure of just how well the transfer rates are over the course of the entire disk. The Disk Transfer Rate test reads from the media in a linear fashion from the beginning (first track) to the end (last track). The numbers below represent the ceiling and floor of the transfer rates throughout the test.
![]()
Click to enlarge.
![]()
Click to enlarge.
HDTach - Sequential Read Speed/Burst Speed
Being our newest test in our desktop hard drive storage suite, the HDTach benchmark gives us a great deal of detail on the performance of a hard drive. Like the WinBench 99 Transfer Rate test, HDTach graphs the sequential read speed of the drive as the drive reads continuously from beginning to end, and calculates the highest burst speed, the average read speed, and the average random access time for the drive.
| HDTach RW Benchmark Results for Seagate 160GB 7200.9 | ||||
| Burst Speed (MB/sec) | Average Read Speed (MB/sec) | Random Access Time (ms) | ||
| Seagate 160GB 7200.9 | 247.6 | 60.3 | 13.2 | |
| Seagate 160GB 7200.9 (2-Drive, RAID-0) | 306.5 | 84.4 | 12.9 | |
| Seagate 500GB 7200.9 | 248.1 | 52.2 | 14.0 | |
We are very happy to see here that the burst speed reported for the single 160GB 7200.9 unit is 247.6 and the results for our dual-drive RAID-0 setup is over 300MB/sec. The average read speed of a single unit is around 60MB/sec while a 2-unit RAID-0 array can read data 20MB/sec faster. The 500GB 7200.9 compares very well to the higher density platters of the 160GB model. Since the 500GB unit uses 133GB platters, we weren't expecting a close race between the two siblings. Still, the 160GB drive is quicker when it comes to average read speed and the random access times, which are extremely important in desktop drives.
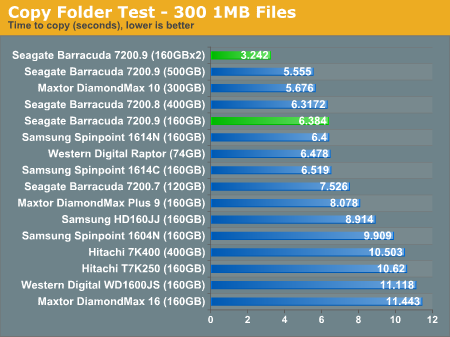
Real World Tests
Synthetic benchmarks are not always the best gauge in measuring the "real" performance of hardware, which is why we have incorporated a few real world tests in our storage reviews. One of our tests, the file system performance test, measures the drive's ability to handle file zip, unzip, and copy operations. This is a great measure of how one drive compares to another and we have put together a group of tasks that most of us typically use.
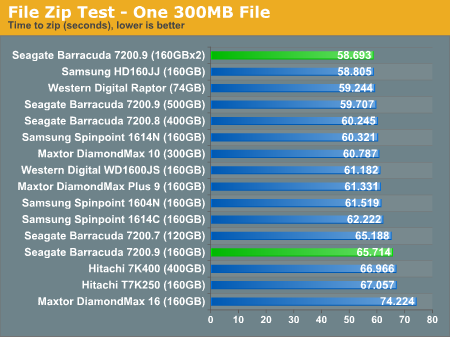
File System Tasks Within Drive
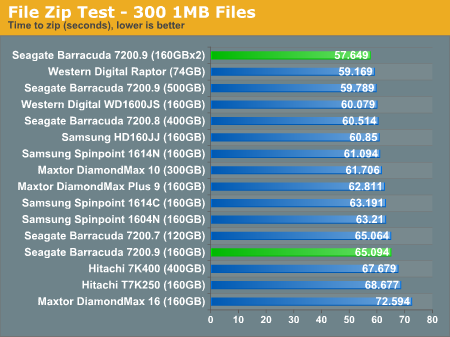
- File Zip Test - We take a 300MB file and measure the time that it takes for our test bed to compress it to ZIP format. We then run the test again with 300 1MB files to see how the drive performs when working with multiple files.
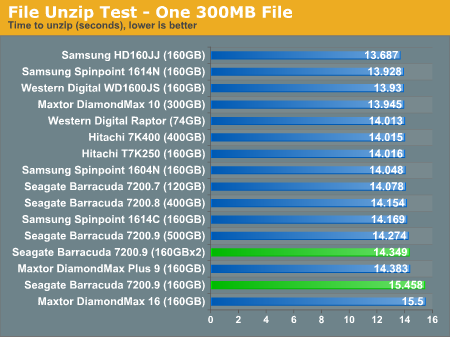
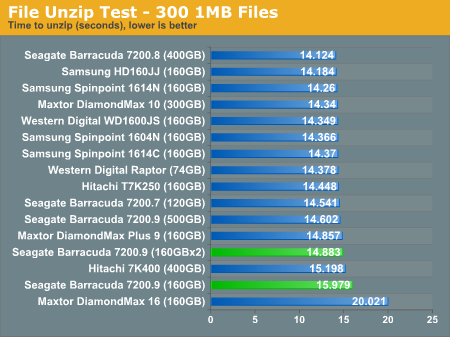
- File Unzip Test - Using the same methodology as the File Zip Test, we take a ZIP file of a single 300MB file as well as a ZIP file of 300 1MB files and measure the time that it takes to uncompress each ZIP successfully.
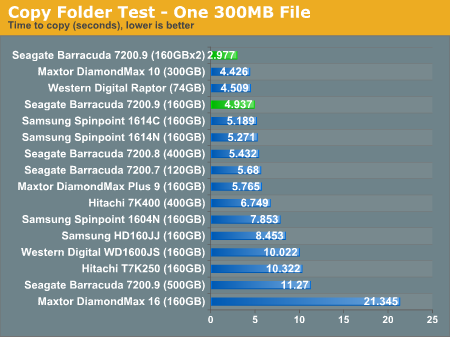
- File Copy Test - We measure how long it takes for the system with our test drive to copy a single 300MB file as well as 300 1MB files.
Real World Tests - Multitasking Performance
To provide a real world example of multitasking, we run Outlook and import 450MB of emails into an account. We then time how long it takes our benchmarking utility to zip a single 300MB file. To compare our results, we calculate the difference between the multitasked process and the single task file zip process.
| Outlook + Zip a 300MB File Within Drive | ||||
| Multitasked | File Zip Only | % Difference | ||
| Seagate 7200.9 160GB | 78.624 | 65.715 | 19.6% | |
| Seagate 7200.9 160GB (2-Drive, RAID-0) | 68.546 | 58.693 | 16.8% | |
| Hitachi T7K250 160GB | 79.815 | 65.641 | 21.6% | |
| Samsung HD160JJ 160GB | 73.554 | 61.068 | 20.4% | |
| Western Digital WD1600JS 160GB | 74.371 | 61.182 | 21.6% | |
| Seagate 7200.9 500GB | 69.512 | 59.785 | 16.3% | |
Real World Tests - Application Load Times
In our Application Load Time tests, we measure the time that it takes for each application to startup. For example, our benchmarking tool begins the stopwatch as soon as PhotoShopCS.exe is run and stops after the application has finished loading all of the plug-ins and filters and shuts down. We take the average of 3 runs with system reboots and hard disk defragmentations before each test run.
| Application Load Times (average, seconds) | |||||
| PhotoShop CS | Word 2003 | Excel 2003 | Access 2003 | PowerPoint 2003 | |
| Seagate 7200.9 160GB | 7.454 | 1.109 | 1.125 | .968 | 1.109 |
| Seagate 7200.9 160GB (2-Drive, RAID-0) | 7.544 | 1.171 | 1.140 | 1.125 | 1.000 |
| Hitachi T7K250 160GB | 7.984 | 2.375 | 2.609 | 2.766 | 2.109 |
| Samsung HD160JJ 160GB | 8.601 | 2.554 | 2.887 | 3.115 | 2.245 |
| Western Digital WD1600JS 160GB | 8.938 | 2.469 | 2.562 | 2.484 | 2.438 |
| Seagate 7200.9 500GB | 8.024 | 1.687 | 1.718 | 1.640 | 1.593 |
The higher density platters of the 160GB unit prove to perform slightly faster when loading the Office 2003 application suite as well as the Photoshop CS imaging software. RAID-0 does not help here at all, but does very little to hurt.
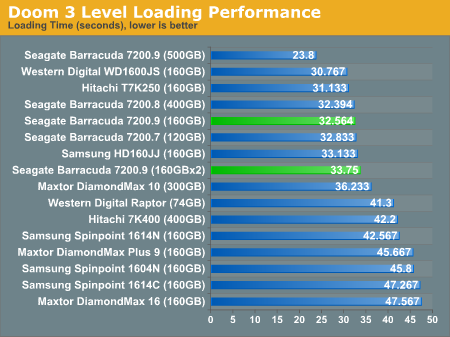
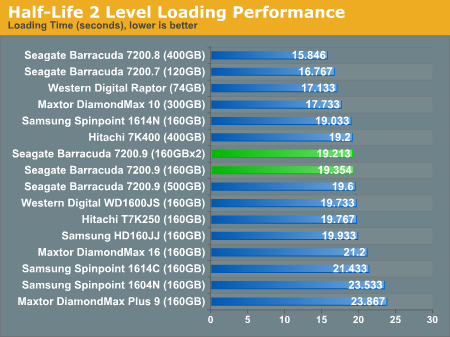
Game Level Load Times
Our Game Level Loading Time tests include two of the latest games: Doom 3 and Half-Life 2. Because of their high resolution textures and the large levels, the loading time for the levels of each game are long enough to help show a difference between each drive.
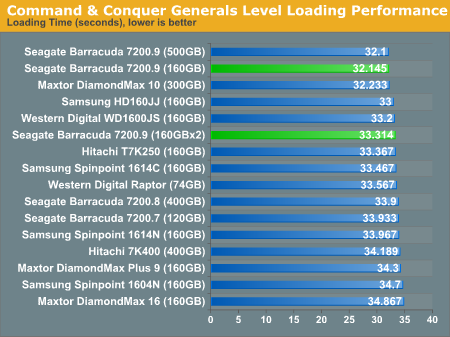
We have also included an older strategy game, Command & Conquer: Generals, because of its longer level load times as well. Though the game is a couple of years old, it still proves to be a good measure of data loading performance.
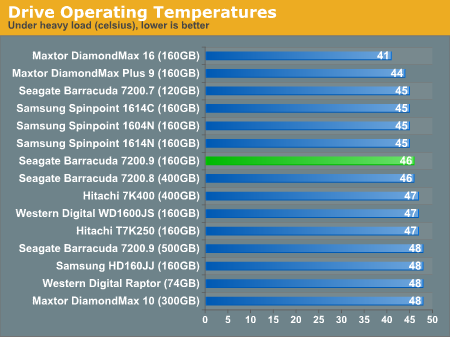
Thermal and Acoustics
Heat and sound are also two very important factors in drive performance especially when considering where they will be used. A loud hard drive that becomes warm very quickly may not be the best choice for home theater PCs or any PC without adequate cooling, and the noise alone could be a bit annoying. Take a look at how each drive performed as far as heat and noise output goes.
Thermal
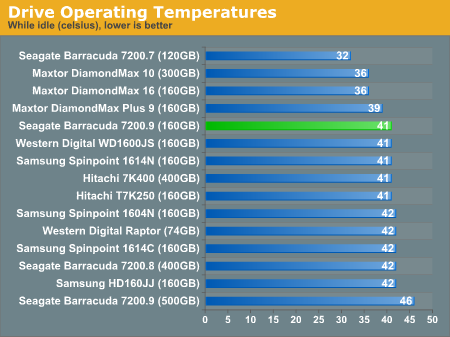
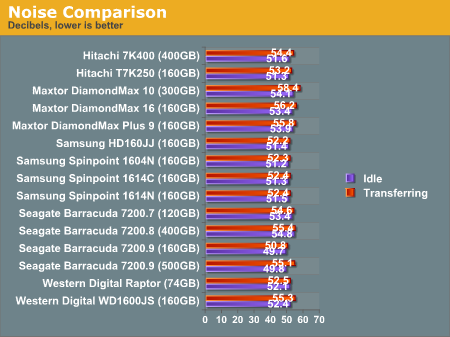
To measure the sound output of each drive, we have taken decibel readings of each at their startup phase as well as the sound output while there is disk activity 1" away from the side of the drive. We try to simulate an environment for this with less than 40dB of background noise.
Final Words
Performance-wise, the 160GB 7200.9 is not a top performer when it comes to game level loading and File Zip and Unzip operations, but it's still far from the bottom of the barrel. Seagate's newest platter design, at 160GB, proves to be a worthy competitor in the long list of hard disk drives that we have benchmarked over the last few years.
We also benchmarked a couple of these drives in a RAID-0 array as a brief look at RAID performance with results that were pleasing to our eyes. The 160GB unit churned out 561 operations per second in our Business Winstone 2004 IPEAK capture benchmark and 378 operations per second in the Content Creation portion of that benchmark. The RAID-0 array, which we set up with two of these 160GB units, produced the highest numbers that we have seen at 869 and 599 operations per second in both the Business Winstone and Content Creation Winstone 2005 IPEAK benchmarks, respectively. The RAID-0 array topped even the best performing drive that we have seen yet, Western Digital's 74GB 10,000RPM Raptor. We are itching to see the performance of a RAID-0 array with the new 150GB Raptors! The RAID-0 array also cuts the write service time in half from 8.67ms to 4.67ms.
The raw performance of the drive was shown in the WinBench99 and HDTach RW results. They reported an average read speed of about 60.3MB/sec while the RAID-0 array read at a rate of 84.4MB/sec. The burst read speeds were 247.6MB/sec and 306.5MB/sec respectively. These tests are not always the best indicators of the real performance of a drive, so we went on to put the 160GB 7200.9 through our set of real world tests.
The File System Tasks include File Zip/Unzip/Copy operations. We didn't see much consistency here as the unit was all over the charts in the time that it took to complete the various operations. We did, however, see an improvement in the RAID-0 array over the single drive setup in all of these benchmarks. The RAID-0 array completed the required operations up to 3 seconds quicker in the File Copy tests and almost 10 seconds quicker in the File Zip Tests, and also topped the 74GB Raptor in some cases.
The other real world tests included game level loads from 3 popular games. The game level load tests proved to be insignificant here as the results were inconsistent. However, we saw a great improvement in the Application Load Time benchmarks. With the 160GB drive as the boot drive, applications started up close to 1 second quicker compared to the others in the list. Though this may seem like a small improvement, the numbers were very consistent across all of the drives.
The end result is a platter density with great potential. Imagine running this drive at 10,000RPM and pitting it against Western Digital's powerhouse Raptor. During our benchmarking process with the 160GB 7200.9, we proved that the performance of SATA drives will increase significantly when thrown in a RAID-0 setup. As for the 160GB 7200.9 as a single product, it has shown us that it can keep up with the latest 3.0GB/sec drives such as Hitachi's T7K250 and Western Digital's WD1600JS as far as performance goes.
Pricing at the time that this review is published is fairly competitive with all three of these drives between $80 and $90. The other difference many may want to consider is the extent of warranty given by each manufacturer. Seagate offers a 5-year warranty on all of its internal hard drive products including both desktop and notebook drives, while Western Digital and Hitachi offer 3 years on their desktop products and 5 years only on enterprise class products such as Hitachi's Ultrastar and Western Digital's enterprise class storage drives.
Seagate has mentioned that they will be implementing the perpendicular magnetic recording method into their desktop drives as soon as Q2/Q3 of this year, which means that we may see high density platters in the drives in 2006. However, they can still get away with implementing 160GB platters with current drives using the longitudinal recording method. It should definitely be an interesting year in hard disk drive products for Seagate.


